boek basearre test «Spiral Dynamics:
Mastering Values, Leadership, and
Change» (ISBN-13: 978-1405133562)
Sponsors

The Tale of the Tall Oak

Once upon a time, there was a tiny oak tree sapling named Peety. Peety dreamed of growing up into a mighty oak tree. 


Each year, Peety grew a little bit taller. He stretched his branches toward the sun and felt his trunk thicken as he grew. 


Over many years, Peety grew from a sapling into a young tree and finally into a tall, mature oak! He was so tall that he could see over the whole forest.


Peety noticed that the other tall oak trees had thick trunks, too. His friend Paul reached high into the sky just like Peety. Paul's trunk was thick and sturdy at the base. 


The small saplings that were sprouting had skinny little trunks. But Peety knew that would change over time as they grew taller.


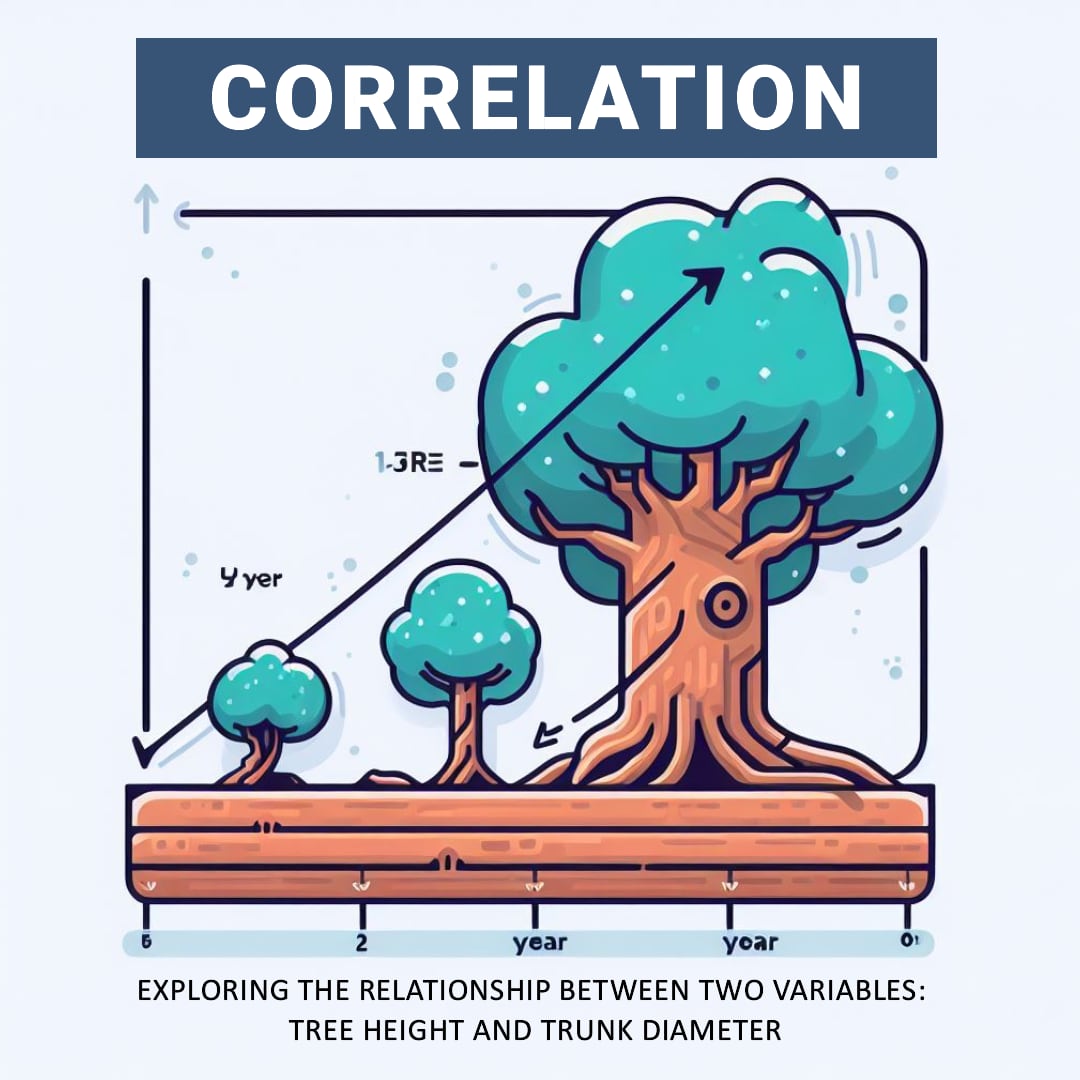
Peety realized that, just like him, the taller an oak tree was, the thicker its trunk became. 


So even though the forest was filled with all different sizes of oak trees, Peety noticed a pattern - a correlation between tree height and trunk width. The tall trees always had thicker trunks, while the small saplings had skinny trunks. This was how pine trees grew strong enough to reach great heights! 


If you record how a tree grows - its height and trunk thickness - and plot it on a picture or graph, then the correlation is when these two things change together. That is, if you see that one is increasing, the other is also increasing, and vice versa.


The SDTEST® gives clues to someone's motivational values. However, additional polls can provide more pieces of the puzzle.


Imagine also giving a "Fears" poll. It asks people to rate different fears from 0 (not scary) to 5 (very scary). 


Now imagine 100 people who took both tests. You could match up each person's SDTEST® colors with their rated fears.


If people high in Blue values feared uncertainty more, that insight ties values to perceptions. Blue people may resist change more.


Or if Orange achievers feared failure most, that reveals their drive. They may overwork to avoid mistakes.


Comparing tests gives an expanded picture of values in action. More puzzle pieces make the whole image more apparent!


Multiple tests can work together, like colors blending on a palette. Other polls reveal what engages your values, like how your hobbies show what activities you enjoy most. Combined, they paint a richer picture of what motivates our thoughts and deeds.


Below you can read an abridged version of the results of our VUCA poll “Fears“. The full results of our VUCA poll “Fears“ are available for free in the FAQ section after login or registration.


Fears

Lân
Taal
-
Mail
Berekkenje
Der is in statistysk signifikant
Normale ferdieling, troch William Sealy Gosset (Student) r = 3.53
Net normale ferdieling, troch Spearman r = 0.14
Fraachfragen
Alle fragen
Alle fragen
Myn grutste eangst is
Distribúsje
Positive korrelaasje,% Negative korrelaasje,%
Normaal
-14.6
Answer 1
-9
Answer 2
-1.3
Answer 3
-8.9
Answer 4
-16.3
Answer 5
-2.9
Answer 6
-4.8
Answer 7
-12.9
Answer 8
-17.3
Answer 9
-12.7
Answer 10
-11.7
Answer 11
-14.5
Answer 12
-15.4
Answer 13
-11
Answer 14
-11.1
Answer 15
-6.9
Answer 16
Normaal
7.6
Answer 3
1
Answer 4
8
Answer 6
5.7
Answer 7
1.2
Answer 8
2.8
Answer 11
3.4
Answer 12
2
Answer 13
1.4
Answer 15
2.2
Answer 16
-1.1
Answer 1
-1.3
Answer 5
-5.4
Answer 9
-1.6
Answer 10
-0.3
Answer 14
Normaal
3.8
Answer 1
3.9
Answer 2
5.1
Answer 3
3.3
Answer 4
0.3
Answer 5
1.6
Answer 6
3.8
Answer 7
3
Answer 8
3.4
Answer 10
1.7
Answer 11
2.6
Answer 12
4.3
Answer 13
7.2
Answer 16
-1.4
Answer 9
-1.1
Answer 14
-1.2
Answer 15
Normaal
8.5
Answer 1
6.7
Answer 2
1.1
Answer 4
6.5
Answer 5
1.2
Answer 8
7.7
Answer 9
2.4
Answer 10
0.1
Answer 11
3.3
Answer 12
2.2
Answer 13
1.5
Answer 15
-5.7
Answer 3
-1.1
Answer 6
-3.1
Answer 7
-0.8
Answer 14
-5.2
Answer 16
Normaal
1.4
Answer 5
1.1
Answer 9
0.8
Answer 11
1.4
Answer 14
-1.1
Answer 1
-3.4
Answer 2
-3.9
Answer 3
-0.1
Answer 4
-5.6
Answer 6
-5
Answer 7
-2.4
Answer 8
-1.7
Answer 10
-3.1
Answer 12
-4
Answer 13
-3.7
Answer 15
-2.8
Answer 16
Net
normaal
2.3
Answer 1
0.2
Answer 2
2.2
Answer 4
11.7
Answer 5
3.5
Answer 7
7.4
Answer 8
15
Answer 9
6.5
Answer 10
4.4
Answer 11
9.3
Answer 12
9.5
Answer 13
10.1
Answer 14
12.3
Answer 15
1.7
Answer 16
-2
Answer 3
Normaal
4.1
Answer 1
2
Answer 2
0.4
Answer 3
3.7
Answer 4
1.4
Answer 5
0.4
Answer 6
2
Answer 7
7.1
Answer 8
5.8
Answer 9
7.2
Answer 10
5.4
Answer 11
2.8
Answer 12
6
Answer 13
6.7
Answer 14
5.9
Answer 15
6.5
Answer 16


Eksportearje nei MS Excel
Dizze funksjonaliteit sil beskikber wêze yn jo eigen VUCA-fraach
Ok

2023.11.22
Valerii Kosenko
Produkt Eigner SAAS PET-projekt SDTest®

Valerii waard kwalifisearre as in sosjale pedagog-psycholooch yn 1993 en hat sûnt syn kennis tapast yn projektbehear.
Valerii krige yn 2013 fan in master en it projekt- en programma Manager, waard hy bekendheid, waard hy bekend mei projekt Roadmap foar projekt (GPM Deutsche Gesellsschaft foar Projekt-management E. V.) en spiraal dynamyk.
Valerii naam ferskate spiraal dynamyk tests en brûkte syn kennis en ûnderfining om de hjoeddeistige ferzje fan Sdtest oan te passen.
Valerii is de auteur fan it ferkennen fan 'e ûnwissichheid fan' e V.U.C.A. Konsept mei spiraal dynamyk en wiskundige statistiken yn psychology, mear dan 20 ynternasjonale fraachpetearen.
Dizze post hat 0 Opmerkings
Antwurdzje op
In antwurd annulearje
Lit jo kommentaar jaan
×
YOU FIND In flater
Propose YOUR ferbetterje FERZJE
Fier jo e-post as winske
Stjoere
ôfbrekke
Bot
sdtest
1
Hoi! Lit my jo freegje, bekend jo al bekend mei spiral-dynamyk?