книга базирана на тест «Spiral Dynamics:
Mastering Values, Leadership, and
Change» (ISBN-13: 978-1405133562)
Спонзори

The Tale of the Tall Oak

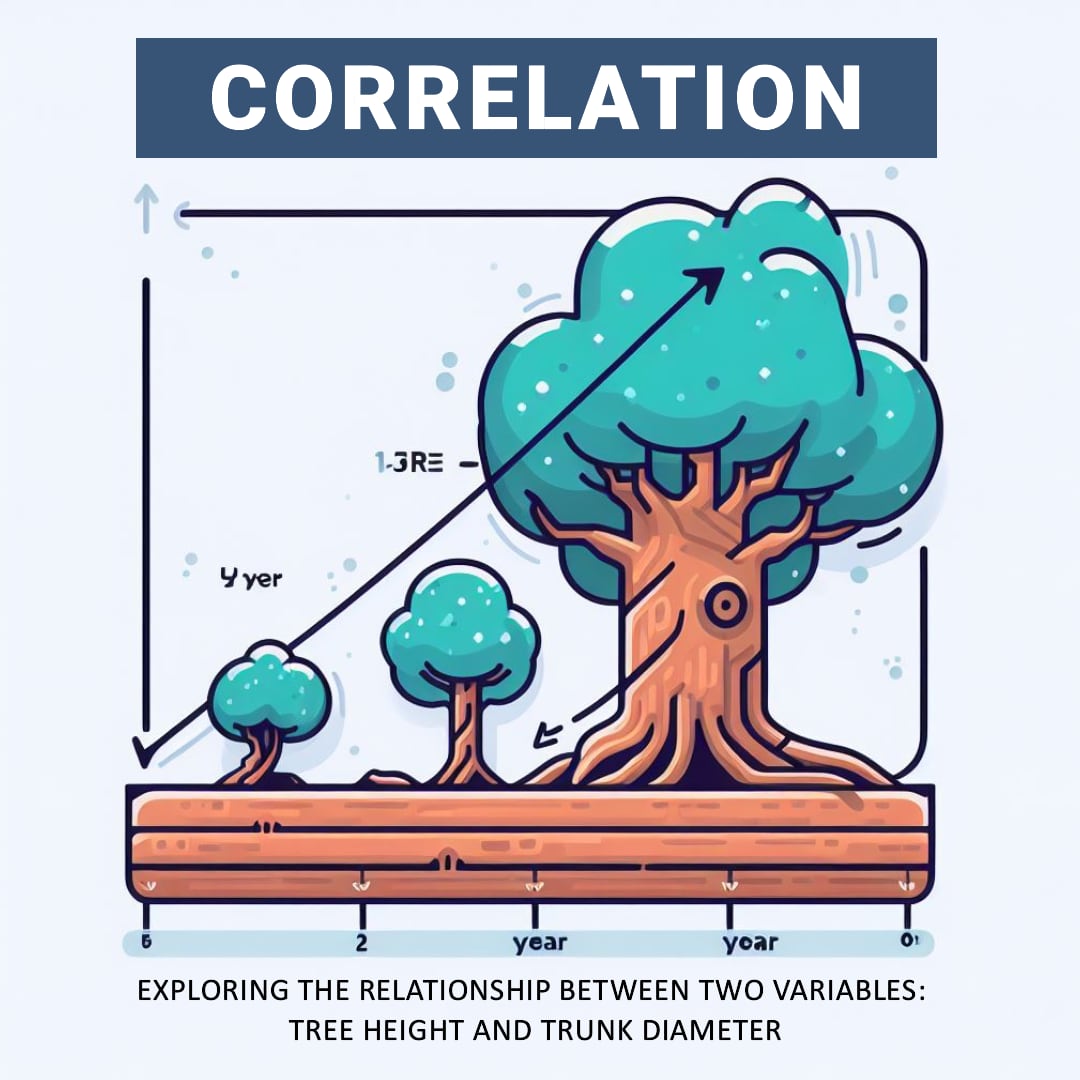
Once upon a time, there was a tiny oak tree sapling named Peety. Peety dreamed of growing up into a mighty oak tree. 


Each year, Peety grew a little bit taller. He stretched his branches toward the sun and felt his trunk thicken as he grew. 


Over many years, Peety grew from a sapling into a young tree and finally into a tall, mature oak! He was so tall that he could see over the whole forest.


Peety noticed that the other tall oak trees had thick trunks, too. His friend Paul reached high into the sky just like Peety. Paul's trunk was thick and sturdy at the base. 


The small saplings that were sprouting had skinny little trunks. But Peety knew that would change over time as they grew taller.


Peety realized that, just like him, the taller an oak tree was, the thicker its trunk became. 


So even though the forest was filled with all different sizes of oak trees, Peety noticed a pattern - a correlation between tree height and trunk width. The tall trees always had thicker trunks, while the small saplings had skinny trunks. This was how pine trees grew strong enough to reach great heights! 


If you record how a tree grows - its height and trunk thickness - and plot it on a picture or graph, then the correlation is when these two things change together. That is, if you see that one is increasing, the other is also increasing, and vice versa.


The SDTEST® gives clues to someone's motivational values. However, additional polls can provide more pieces of the puzzle.


Imagine also giving a "Fears" poll. It asks people to rate different fears from 0 (not scary) to 5 (very scary). 


Now imagine 100 people who took both tests. You could match up each person's SDTEST® colors with their rated fears.


If people high in Blue values feared uncertainty more, that insight ties values to perceptions. Blue people may resist change more.


Or if Orange achievers feared failure most, that reveals their drive. They may overwork to avoid mistakes.


Comparing tests gives an expanded picture of values in action. More puzzle pieces make the whole image more apparent!


Multiple tests can work together, like colors blending on a palette. Other polls reveal what engages your values, like how your hobbies show what activities you enjoy most. Combined, they paint a richer picture of what motivates our thoughts and deeds.


Below you can read an abridged version of the results of our VUCA poll “Fears“. The full results of our VUCA poll “Fears“ are available for free in the FAQ section after login or registration.


Стравувања

земја
Јазик
-
Mail
Пресметка
Постои статистички значајна корелација
Нормална дистрибуција, од Вилијам Сеали Госет (студент) r = 3.53
Не нормална дистрибуција, од Спирман r = 0.14
Прашања за анкета
Сите прашања
Сите прашања
Мојот најголем страв е
Дистрибуција
Позитивна корелација,% Негативна корелација,%
Нормално
-14.6
Answer 1
-9
Answer 2
-1.3
Answer 3
-8.9
Answer 4
-16.2
Answer 5
-2.9
Answer 6
-4.8
Answer 7
-12.9
Answer 8
-17.3
Answer 9
-12.7
Answer 10
-11.7
Answer 11
-14.5
Answer 12
-15.4
Answer 13
-10.9
Answer 14
-11.1
Answer 15
-7
Answer 16
Нормално
7.6
Answer 3
0.9
Answer 4
8
Answer 6
5.7
Answer 7
1.1
Answer 8
2.8
Answer 11
3.4
Answer 12
2.1
Answer 13
1.4
Answer 15
2.2
Answer 16
-1.1
Answer 1
-1.3
Answer 5
-5.5
Answer 9
-1.6
Answer 10
-0.3
Answer 14
Нормално
3.8
Answer 1
3.9
Answer 2
5.1
Answer 3
3.2
Answer 4
0.3
Answer 5
1.6
Answer 6
3.8
Answer 7
3
Answer 8
3.4
Answer 10
1.7
Answer 11
2.6
Answer 12
4.3
Answer 13
7.2
Answer 16
-1.5
Answer 9
-1.1
Answer 14
-1.1
Answer 15
Нормално
8.5
Answer 1
6.7
Answer 2
1.1
Answer 4
6.6
Answer 5
1.2
Answer 8
7.7
Answer 9
2.5
Answer 10
0.2
Answer 11
3.3
Answer 12
2.1
Answer 13
1.5
Answer 15
-5.6
Answer 3
-1.1
Answer 6
-3.1
Answer 7
-0.7
Answer 14
-5.2
Answer 16
Нормално
1.4
Answer 5
1.1
Answer 9
0.7
Answer 11
1.4
Answer 14
-1.1
Answer 1
-3.4
Answer 2
-4
Answer 3
-0.2
Answer 4
-5.6
Answer 6
-5
Answer 7
-2.5
Answer 8
-1.7
Answer 10
-3.1
Answer 12
-4
Answer 13
-3.6
Answer 15
-2.8
Answer 16
Не
нормално
2.3
Answer 1
0.2
Answer 2
2.2
Answer 4
11.8
Answer 5
3.5
Answer 7
7.5
Answer 8
15.1
Answer 9
6.6
Answer 10
4.5
Answer 11
9.3
Answer 12
9.5
Answer 13
10.1
Answer 14
12.3
Answer 15
1.7
Answer 16
-2
Answer 3
Нормално
4.1
Answer 1
2
Answer 2
0.4
Answer 3
3.6
Answer 4
1.4
Answer 5
0.4
Answer 6
2
Answer 7
7.1
Answer 8
5.8
Answer 9
7.2
Answer 10
5.4
Answer 11
2.8
Answer 12
6
Answer 13
6.7
Answer 14
5.9
Answer 15
6.5
Answer 16


Извоз во MS Excel
Оваа функционалност ќе биде достапна во вашите избори во VUCA
Добро

2023.11.22
Валери Косенко
Сопственик на производи Saas PET PECTION SDTEST®

Валери беше квалификуван како социјален педагог-психолог во 1993 година и оттогаш го примени своето знаење за управување со проекти.
Валери се стекна со магистерски студии и квалификација на проект и програмски менаџер во 2013 година. За време на магистерската програма, тој се запозна со Project Moadmap (GPM Deutsche Gesellschaft für Projektmanagement e. V.) и спирална динамика.
Валери зеде разни тестови за спирална динамика и го искористи своето знаење и искуство за да ја прилагоди тековната верзија на SDTEST.
Валери е автор на истражување на неизвесноста на V.U.C.A. Концепт со употреба на спирална динамика и математичка статистика во психологијата, повеќе од 20 меѓународни анкети.
Овој пост има 0 Коментари
Одговори на
Откажете одговор
Оставете го вашиот коментар
×
Ќе се најде грешка
Предложите Ваша правиот верзија
Внесете ја вашата e-mail, како сакате
испрати
Откажи
Bot
sdtest
1
Здраво! Дозволете ми да ве прашам, дали веќе сте запознаени со спиралната динамика?